Reports (a module) is the answer to "can you get me a list of…". Reports → Report builder lists every built-in report — failing grades, attendance, tuition, enrollment and more — and lets you build your own.
- Open Reports → Report builder and choose + New report. Start from a blank report (pick what each row is — a student, a family, an invoice…) or from a template.
- On the Columns tab, choose the columns and time frame. On Conditions, filter the rows (tick Ask each run to choose a value every time). Group, Highlight and Print shape the rest.
- On the Charts tab, add a Bar, Column, Line, Donut or Number tile and choose whether charts sit above the table, below it, or alone.
- Name it and choose Save report. Saved reports open with Edit, Email on a schedule, Print and Export CSV.
Built-in reports have filters of their own; choose Save view to keep the exact filters (you'll find them under Saved reports) and Export CSV for Excel or Google Sheets.
The dashboard
On any chart in a saved report, choose Pin to add it to Reports → Dashboard — your most-watched numbers on one page, live. A tile's ⋯ moves it, resizes it, or unpins it.
Scheduled email reports
Any report can arrive by itself. Open Reports → Scheduled and choose + Schedule report: pick the report, a frequency (weekly on a day, or monthly on a date from 1–28), and the email addresses to send to. Custom reports arrive with their charts.
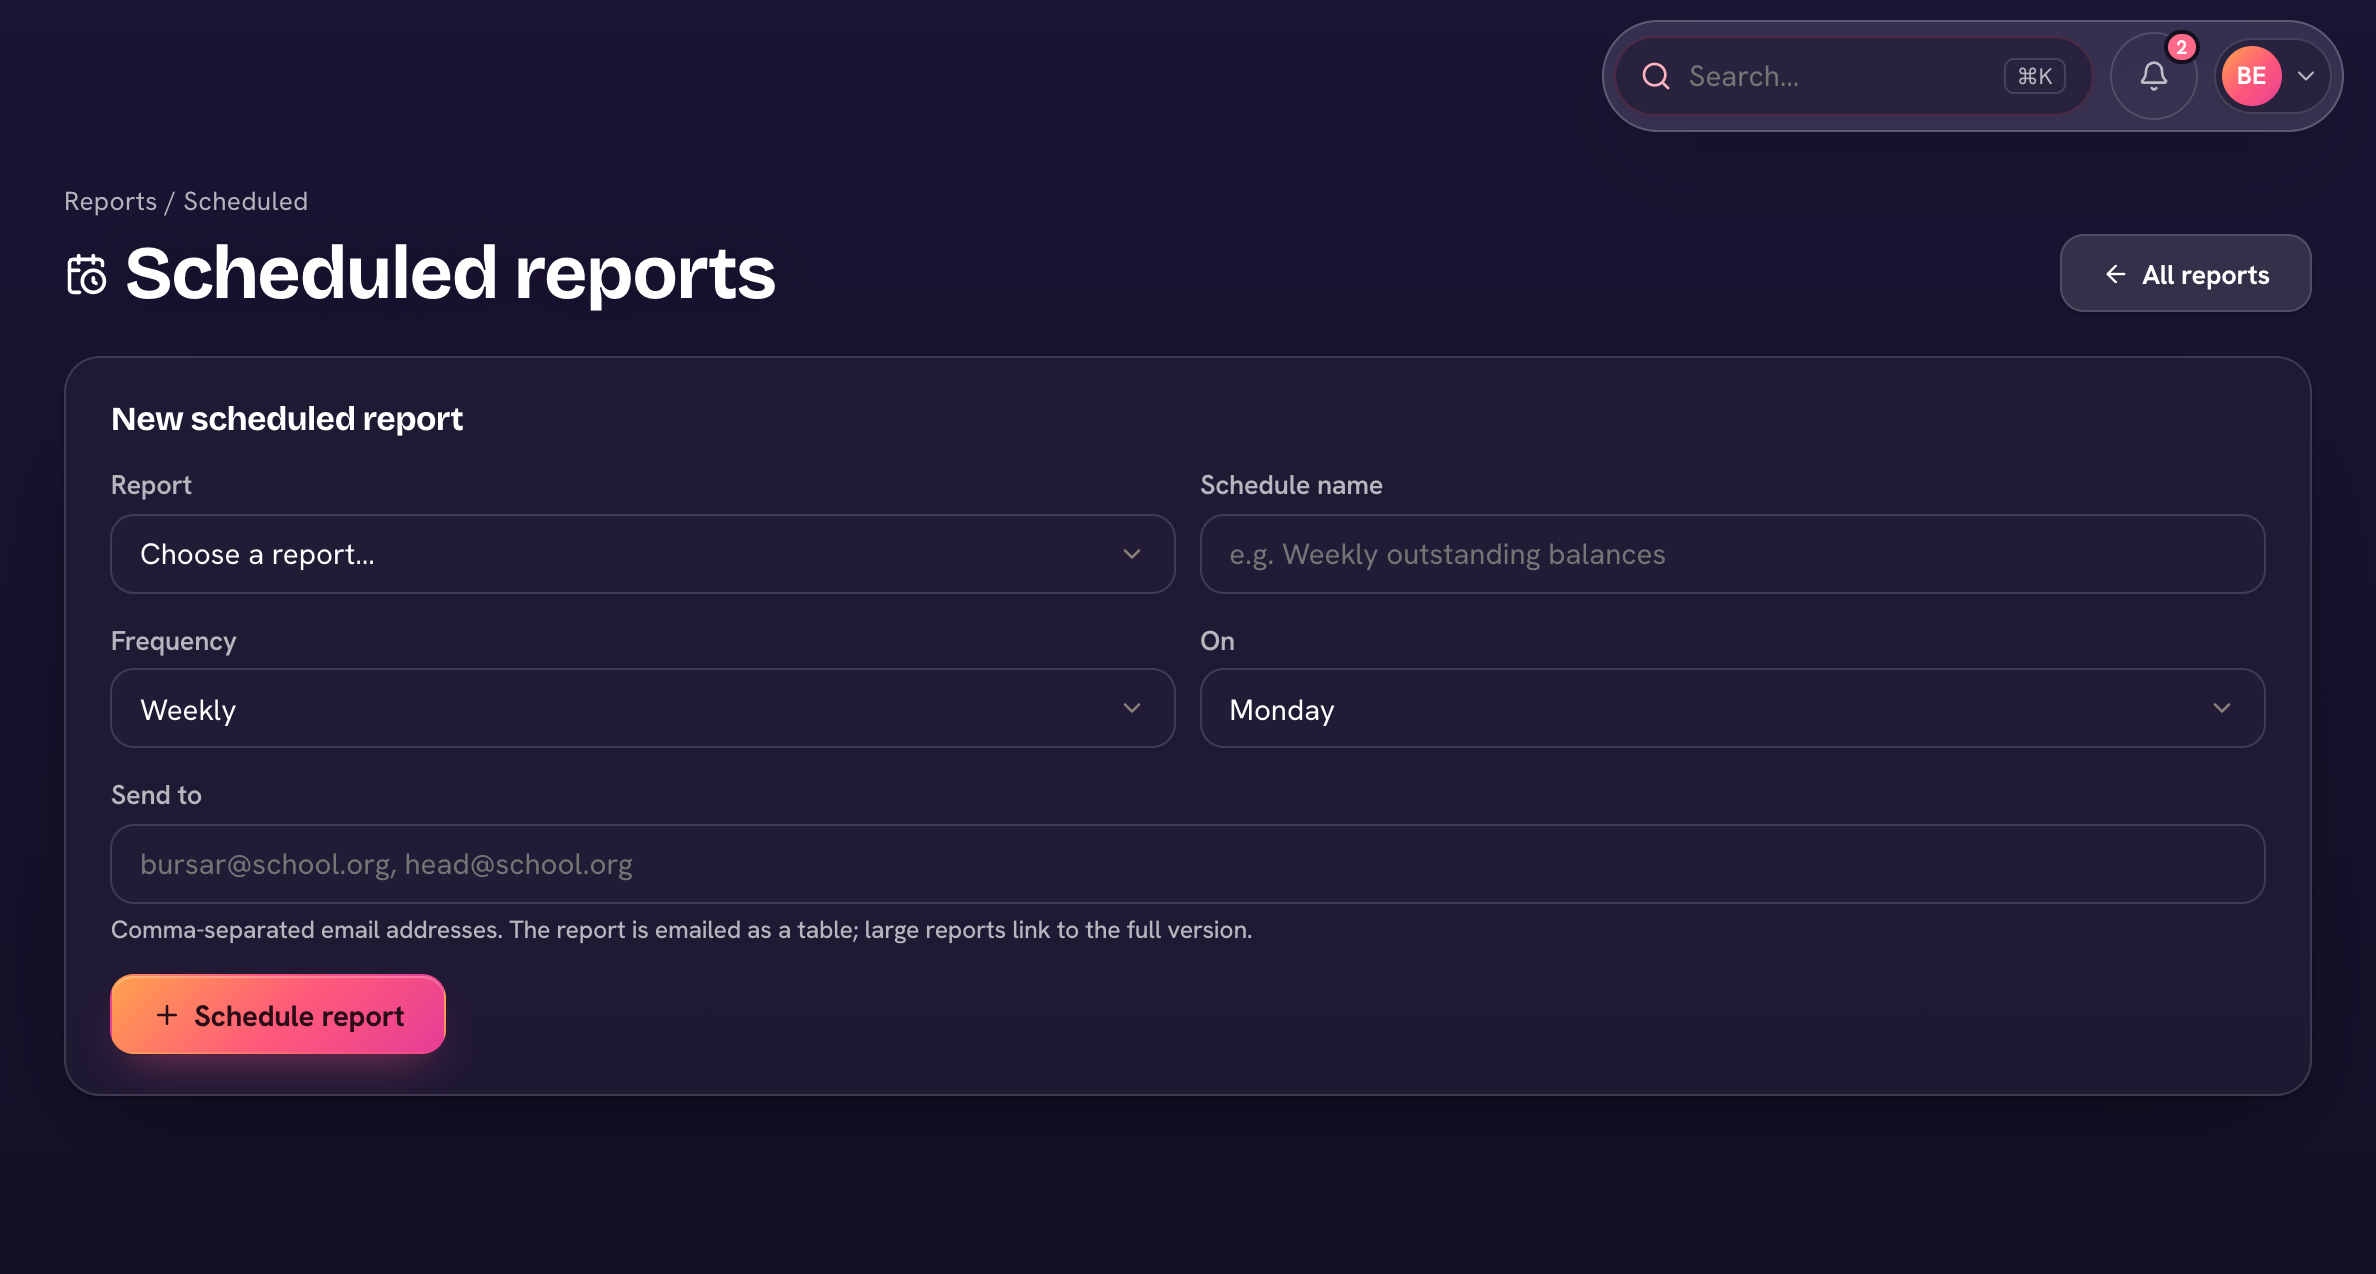
A schedule's ⋯ has Send a test to me, and Pause / Resume — pause instead of deleting to keep the setup for later.